Graphic design
in safety
How graphic design is used to make information accessible in health & safety.
Graphic design plays a critical role in ensuring that health and safety information is accessible, engaging, and easy to comprehend. Well-designed posters, infographics, icons, and visualizations can significantly influence social behaviour by guiding actions, raising awareness, and shaping public attitudes. Visual communication is especially important in health and safety contexts, ensuring essential information is understood quickly, even by individuals with low literacy levels or those facing language barriers.
The Effectiveness of Infographics
Infographics are a powerful method for distilling complex information into visual cues with minimal text. With the rise of social media, infographics have become an increasingly popular way to effectively convey information. Traboco et al. (2022) define infographics as tools designed to present complex informational content in a visually appealing and digestible format that supports cognitive processing, learning, retention, and behavior change.
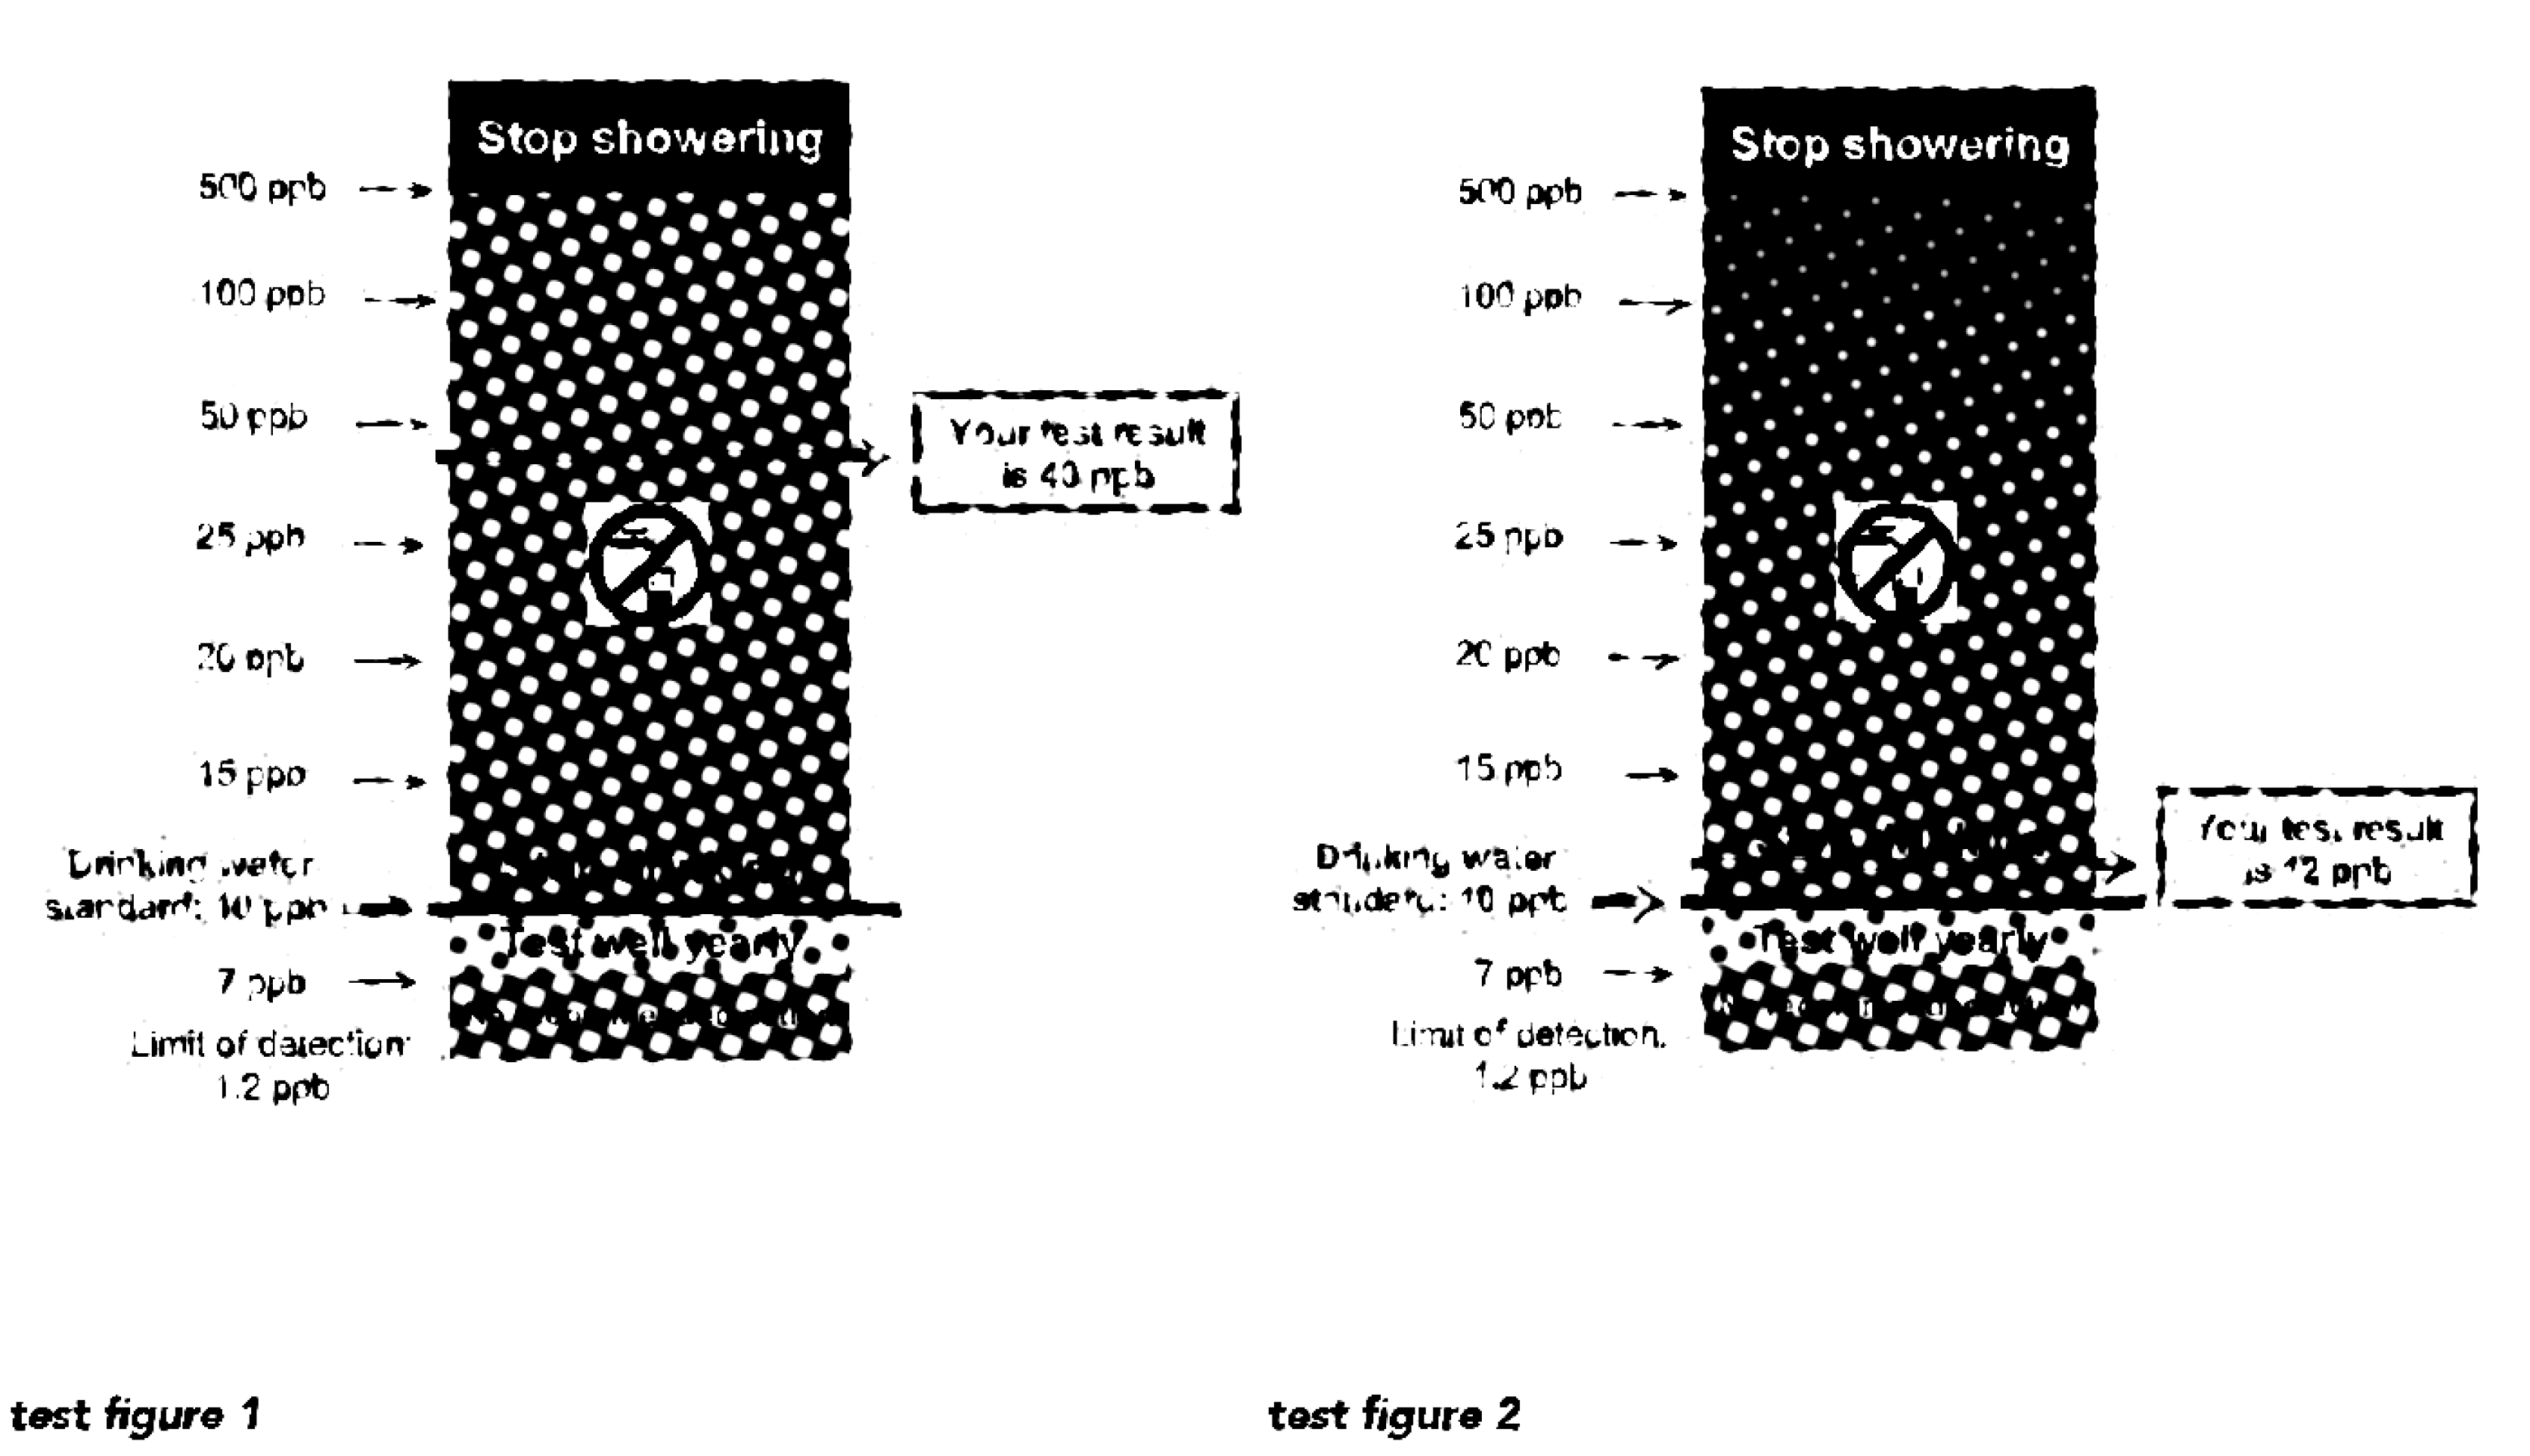
Research has shown that visual representations of risk information can significantly influence people's understanding, beliefs, and actions. Severtson et al. (2009) found that bold colors and simple icons (e.g., red warning signs) led to stronger and more enduring risk mitigation intentions. The study revealed gender-based differences in responses: males reacted more strongly to high-contrast images, while females processed graded images more effectively.
Gender and Cultural Influence on Infographic Effectiveness
Studies have also shown that the effectiveness of infographics varies by demographic factors. Lawson et al. (2019) found that hand hygiene posters had a higher influence on women’s behavior compared to men’s. Similarly, Levie (1987) discovered that individuals with low literacy levels in South Africa had significantly higher comprehension of locally developed pictures compared to standardized ones. This underscores the importance of cultural relevance in graphic design, raising questions about the neutrality of design and the importance of user experience in creating effective health and safety graphics.
The Role of Visual Memorability
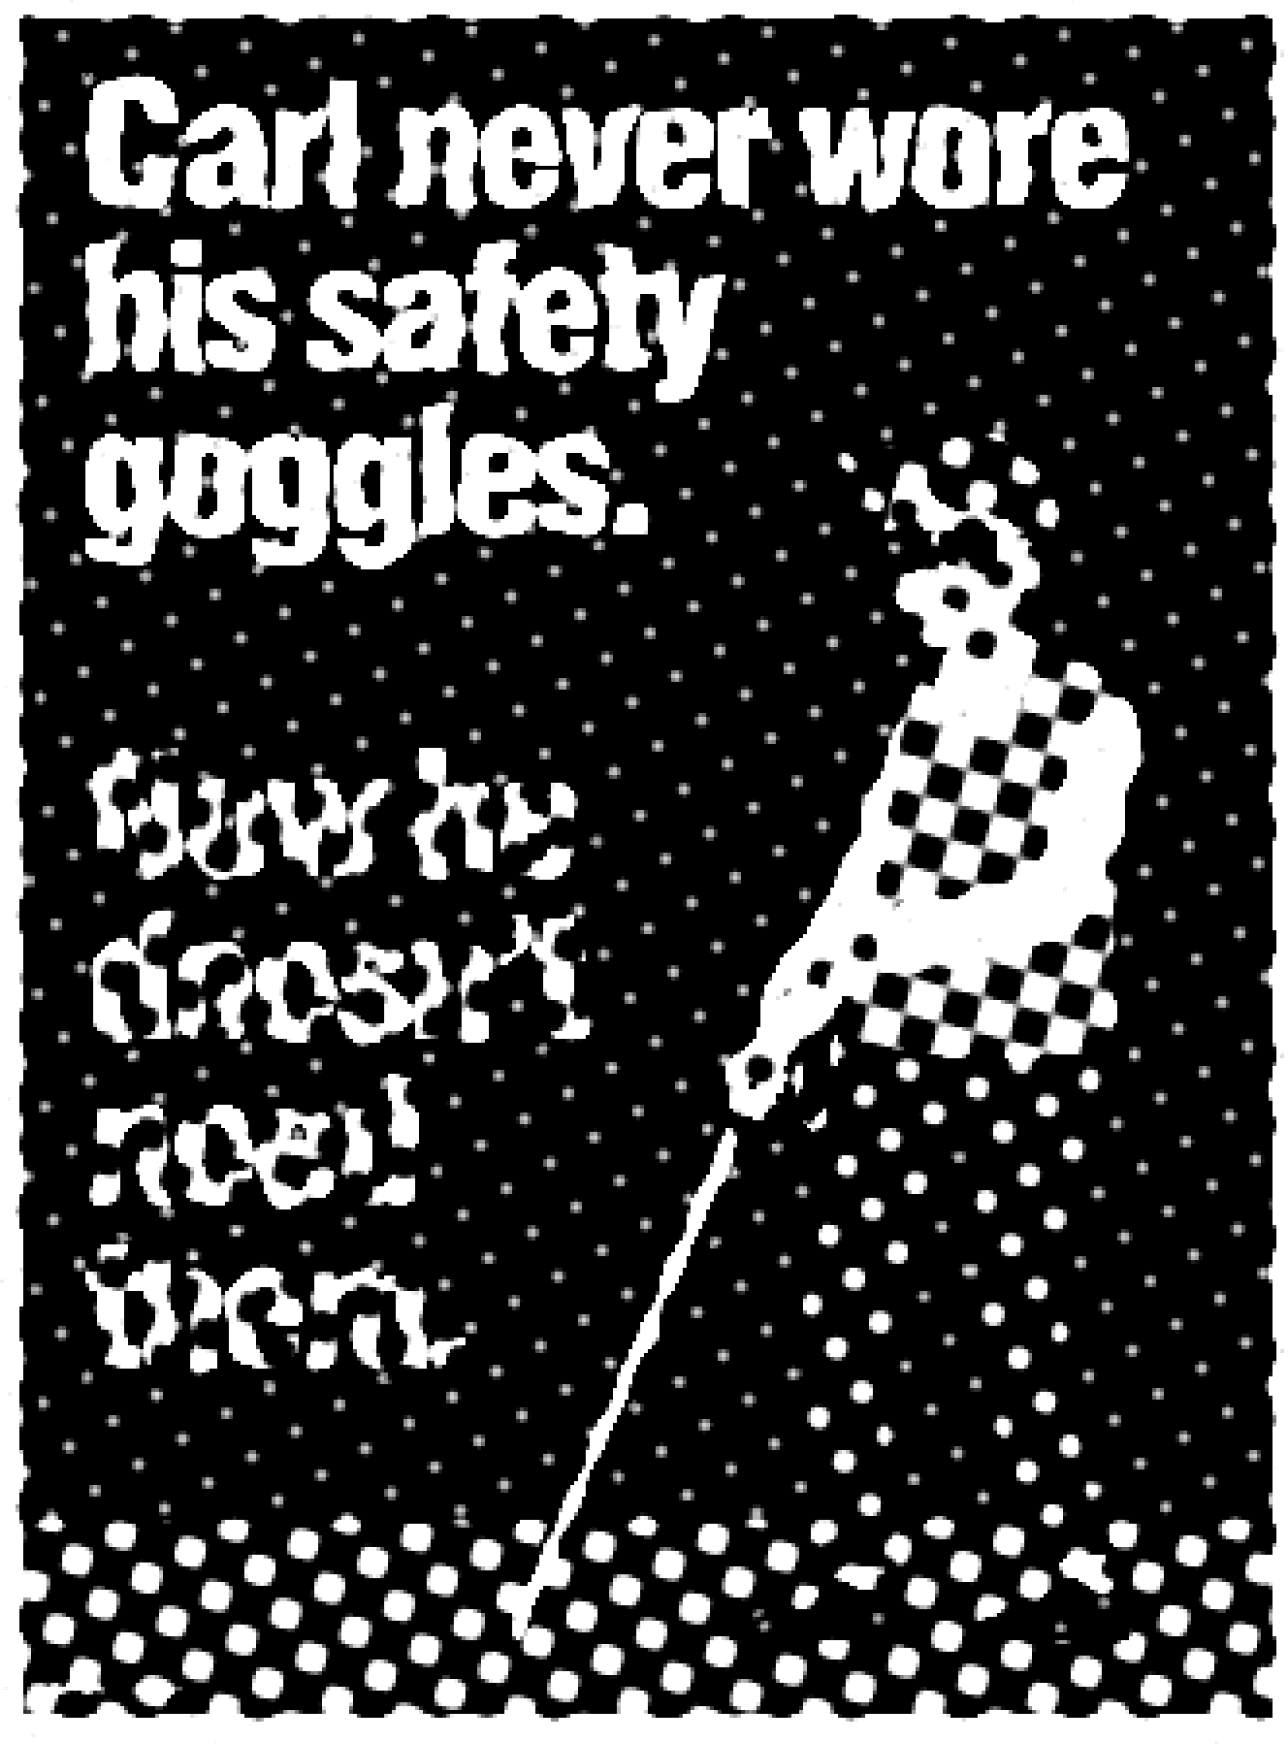
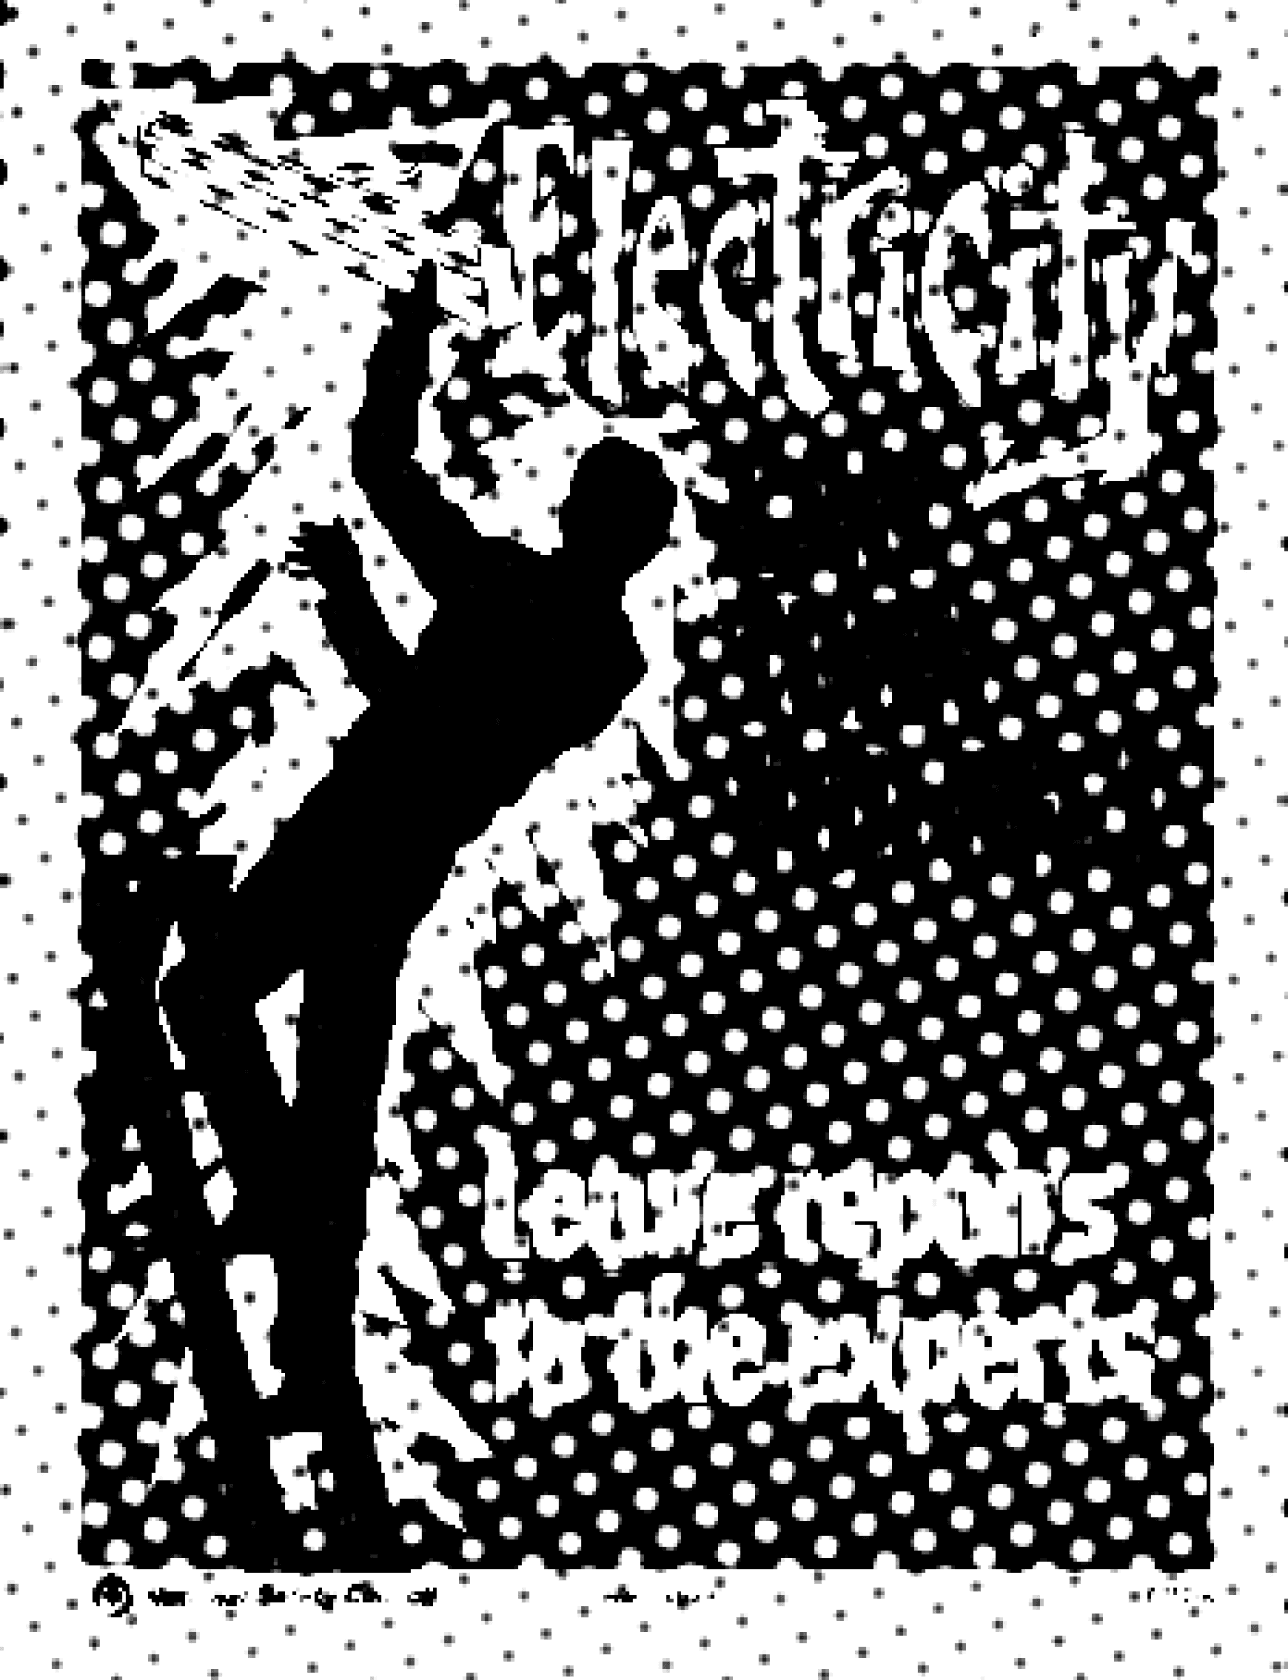
Workplace safety signs and public health posters use cartoonish imagery, bold typefaces, and striking colors to ensure information is easily recognizable and memorable. Delp and Jones (1996) [1] examined the effectiveness of illustrated versus text-only health instructions and found that 77% of patients with illustrated instructions followed wound care directions, compared to just 54% of those with text-only instructions. The effect was especially pronounced among individuals with lower levels of education.
The Importance of Clear Visual Cues
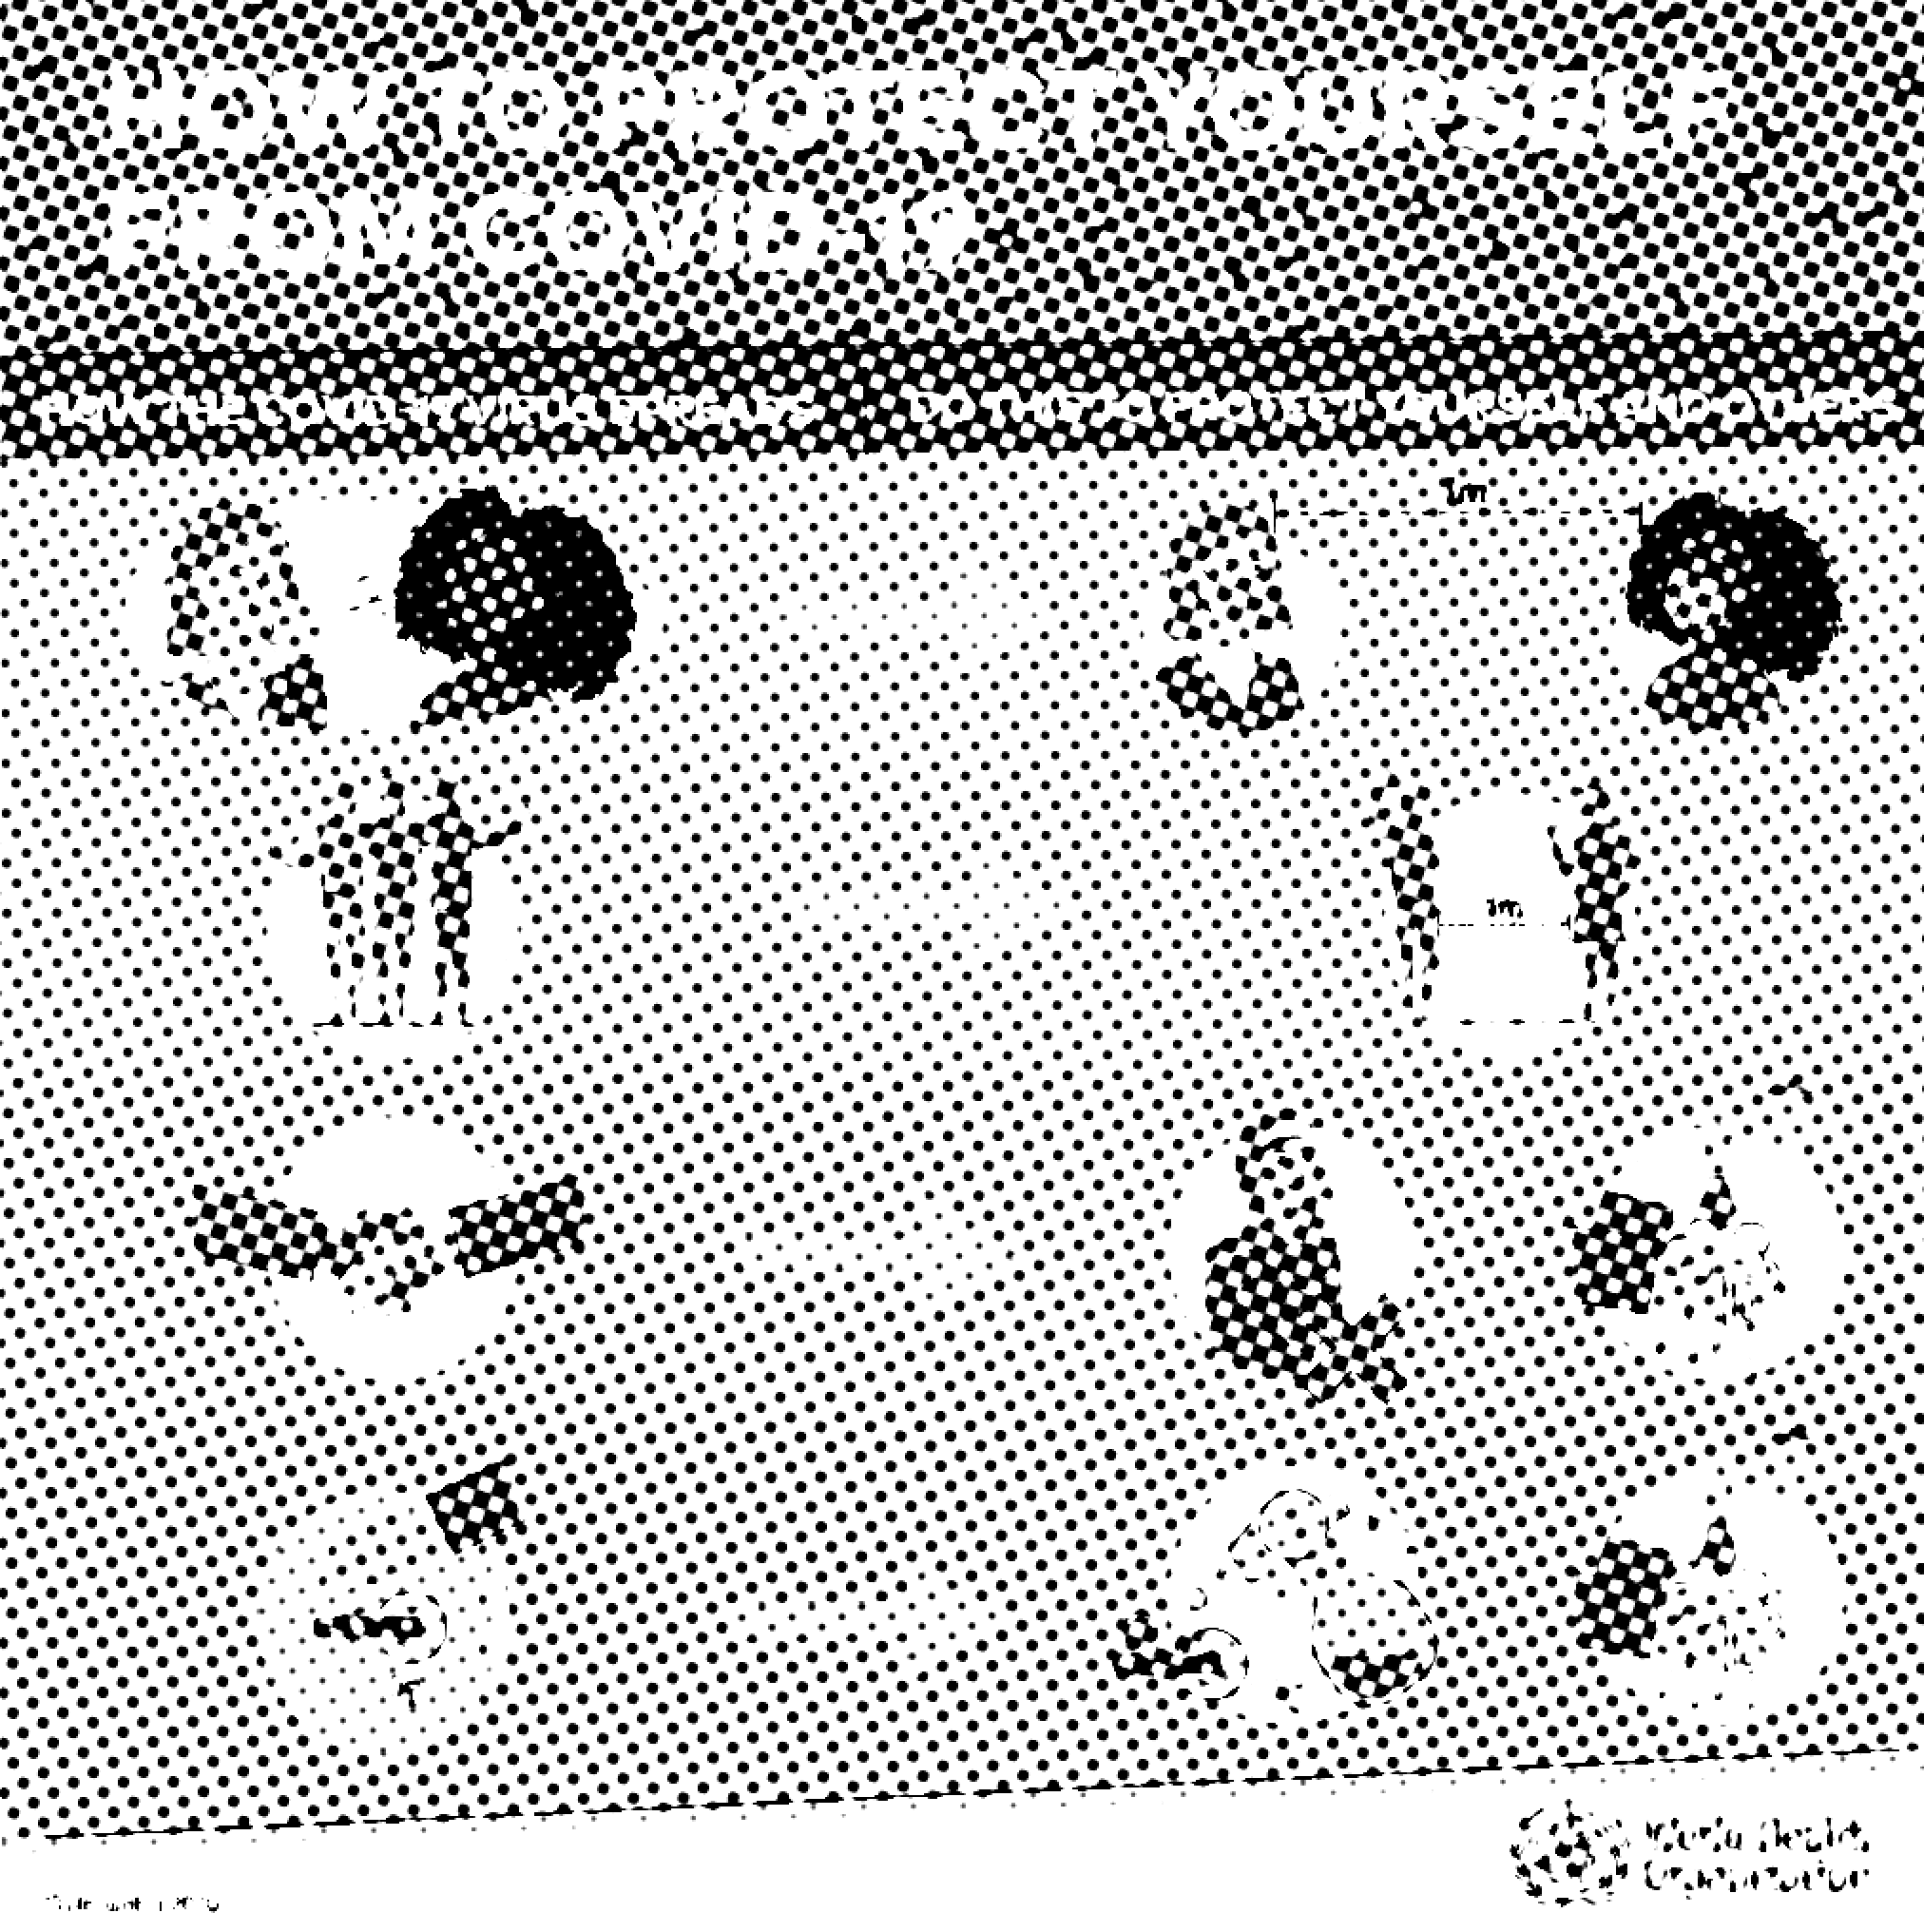
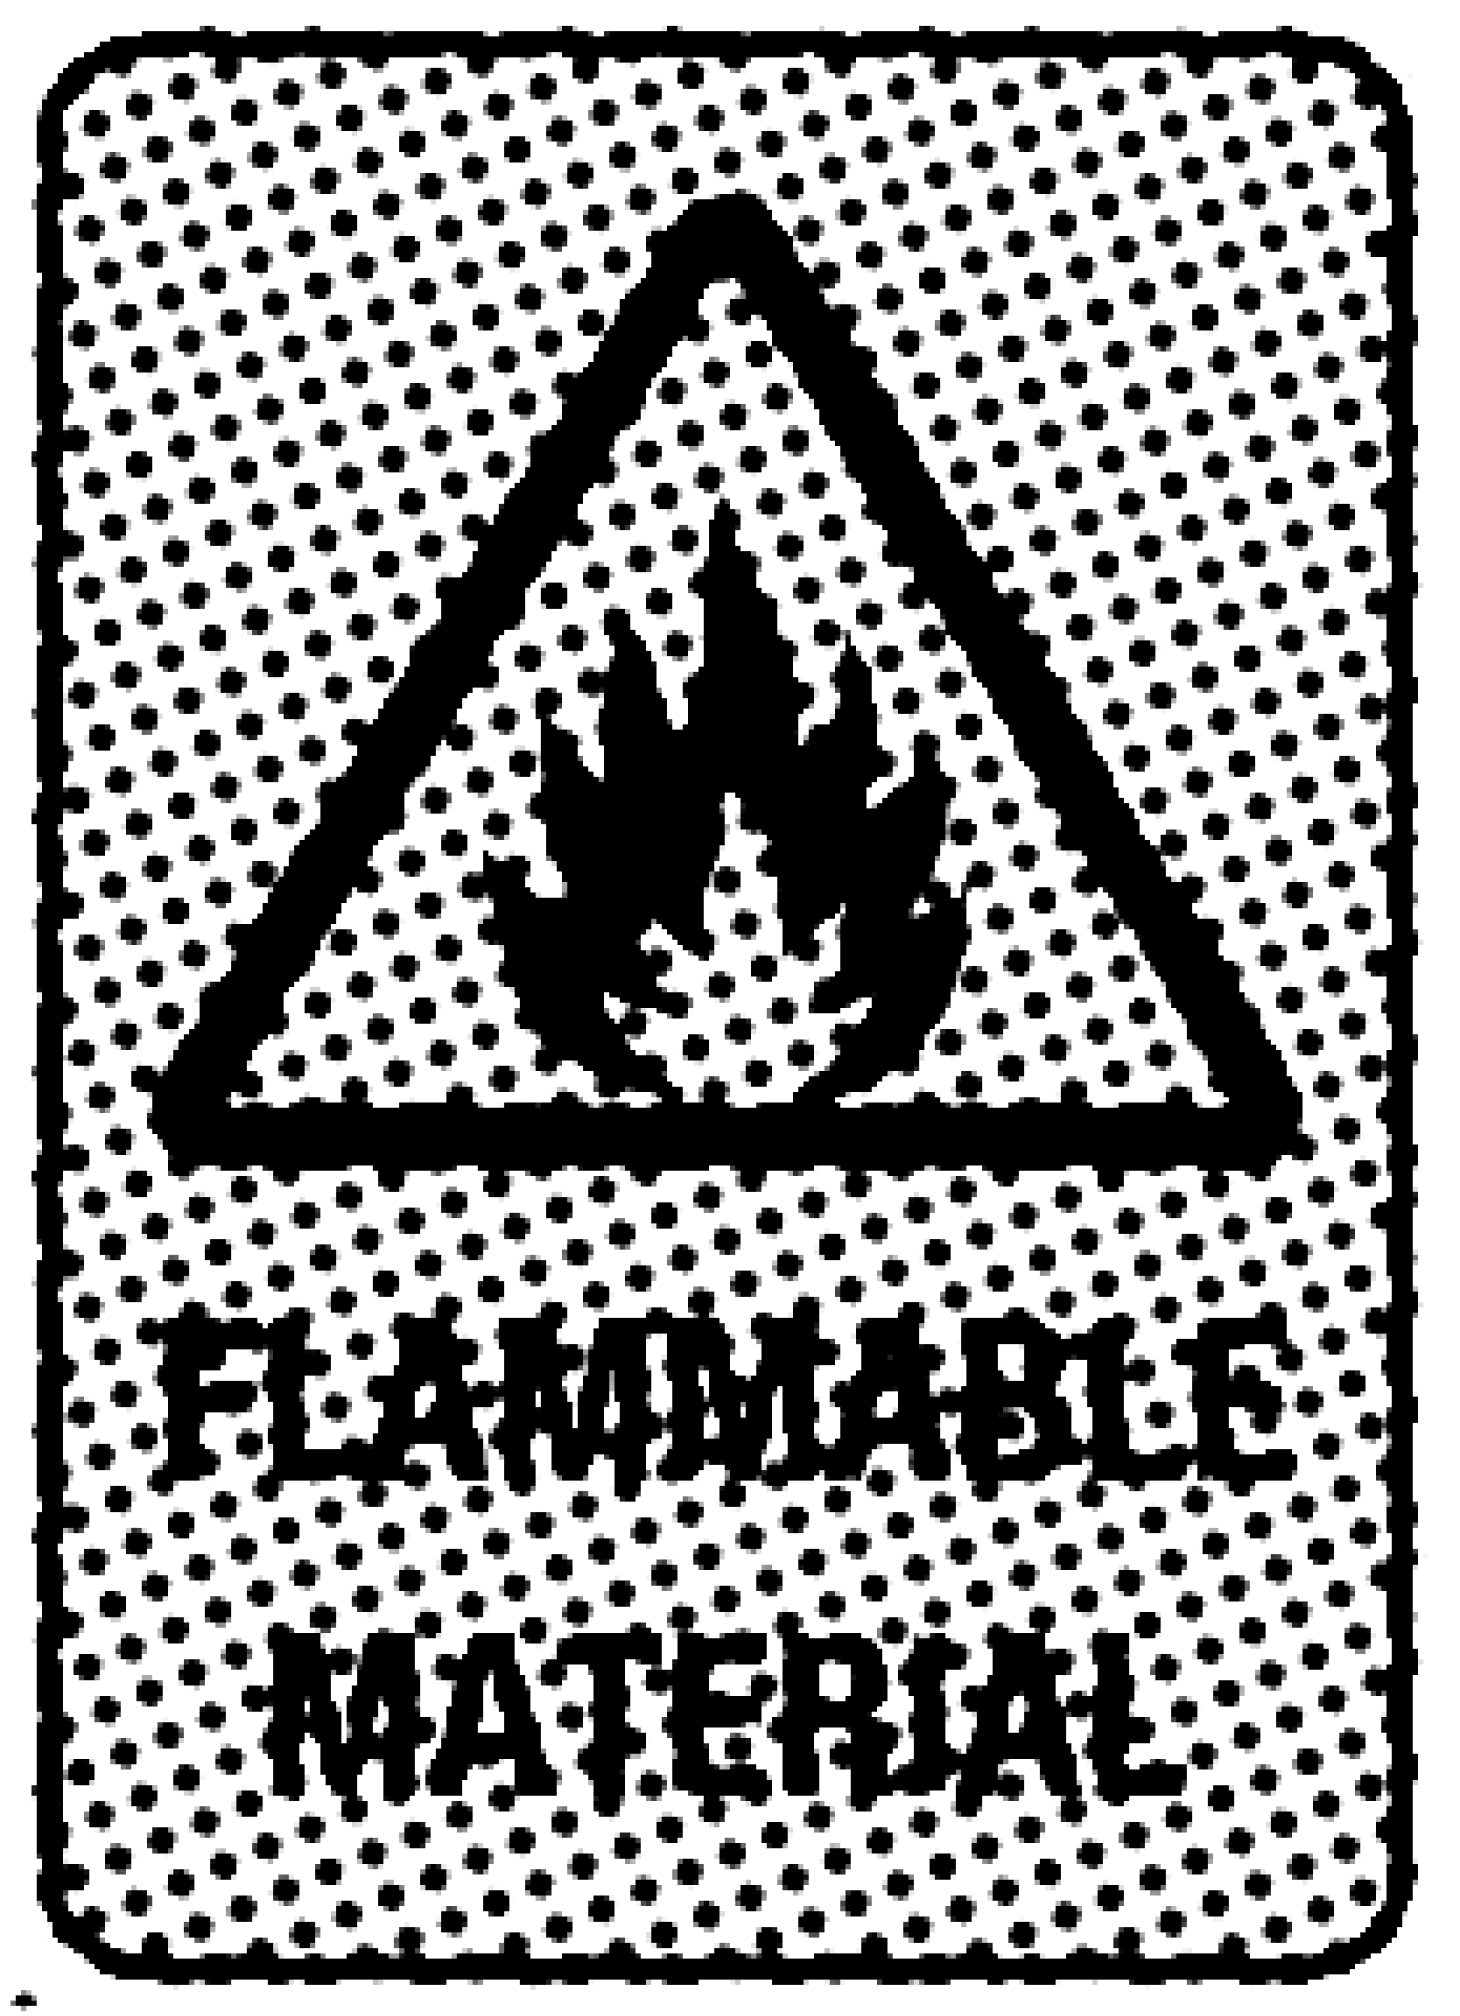
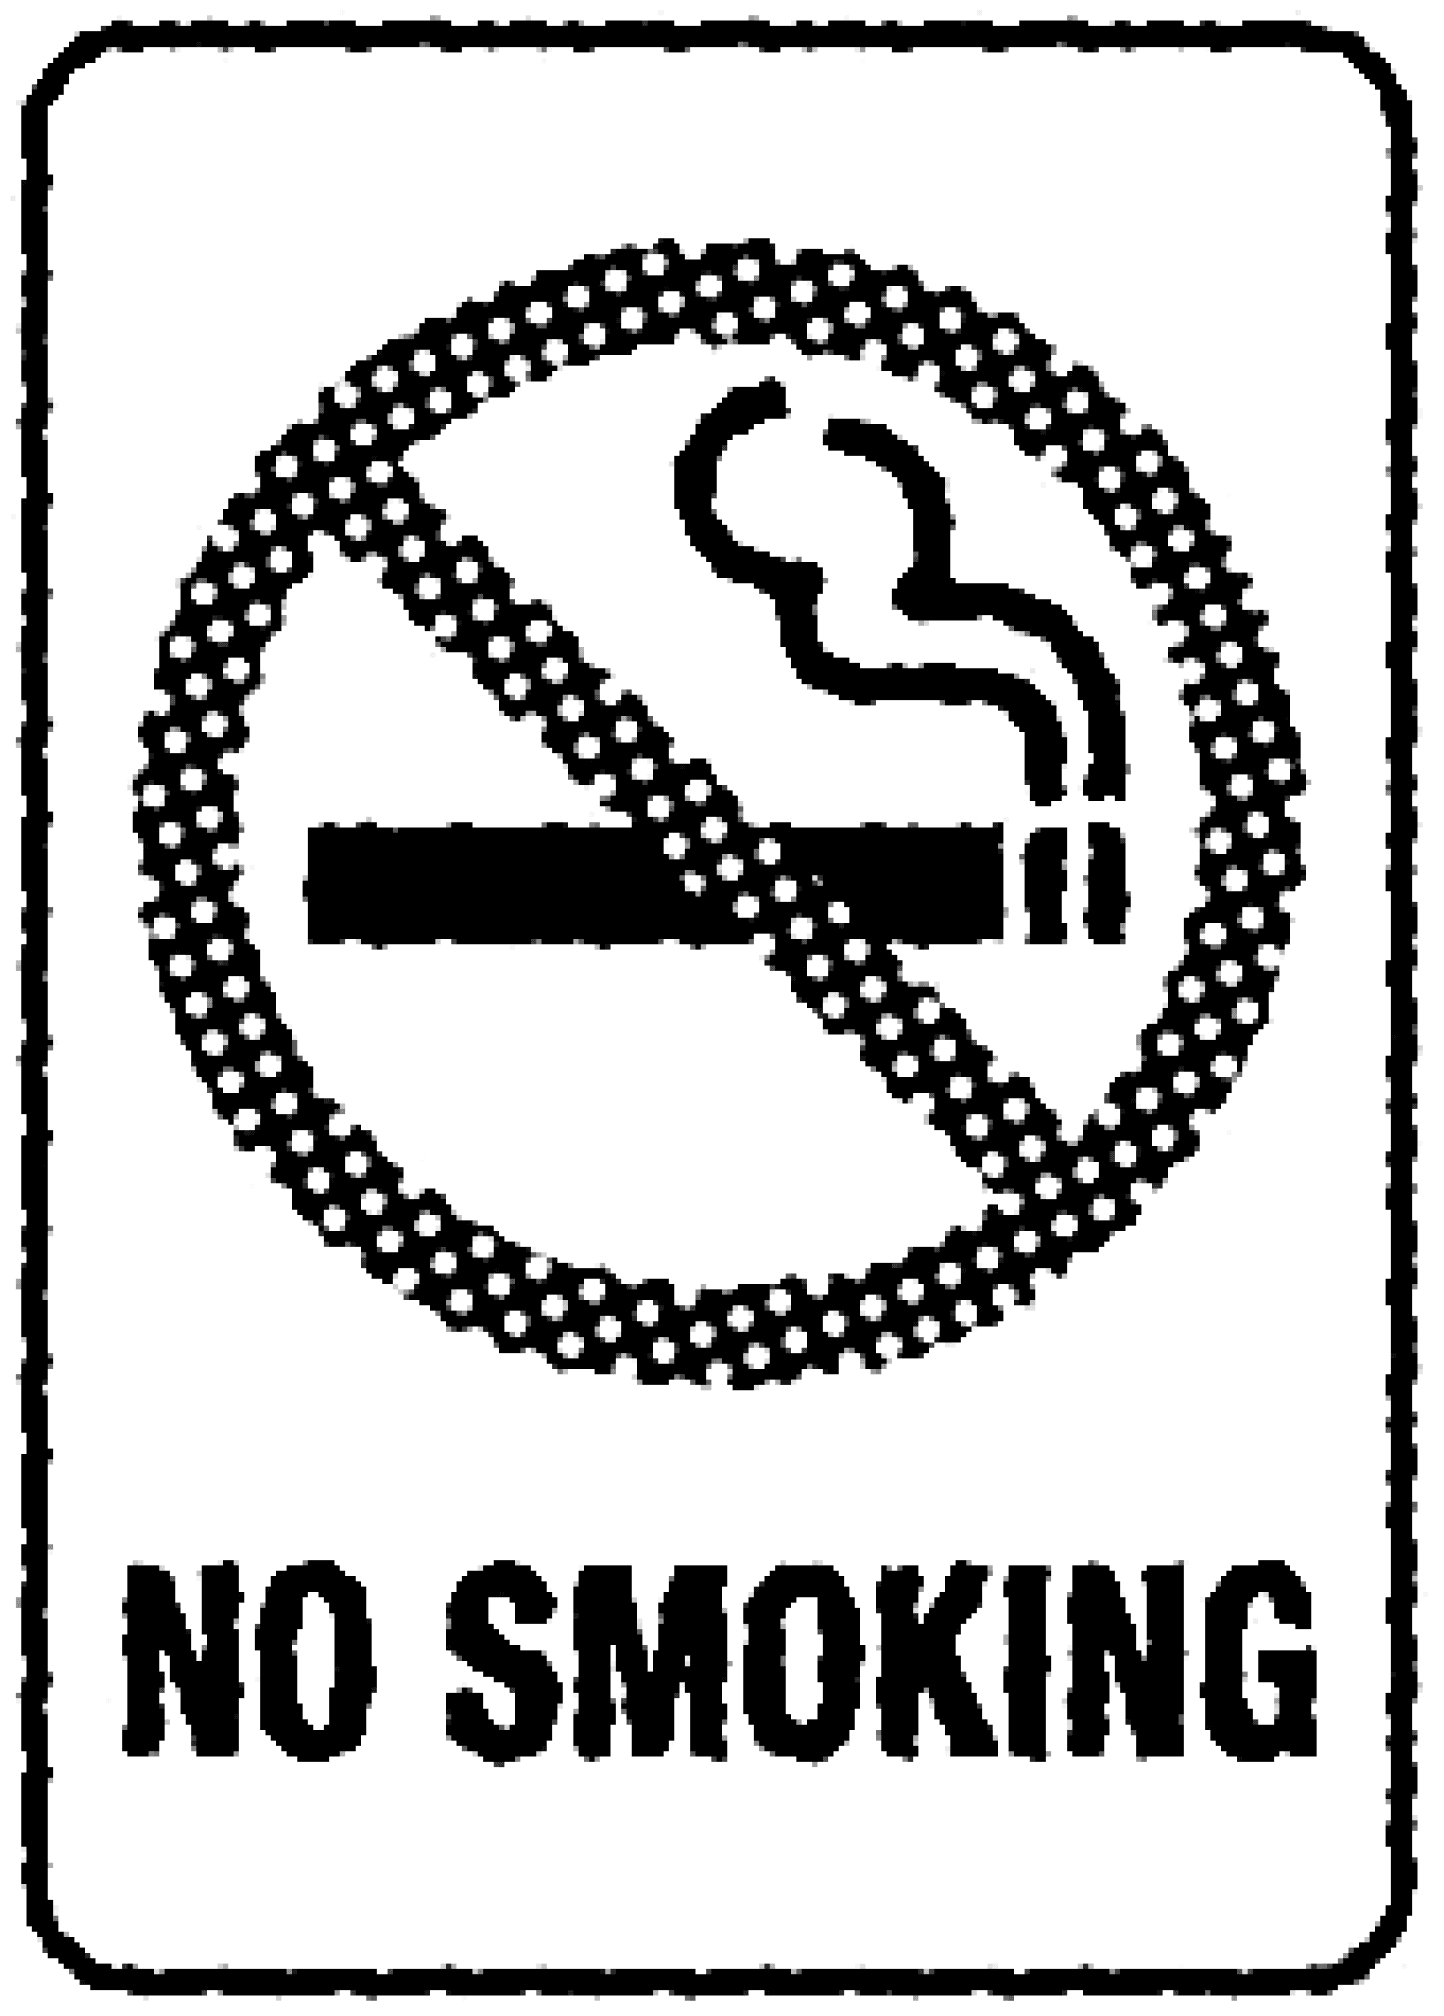
Universal symbols and pictograms are widely used in workplace safety and public health communication. Their goal is to facilitate quick recognition and understanding, regardless of language barriers. However, no symbol can be considered truly "universal"—designers must take into account audience, culture, and purpose when creating visual messages.
Emergency Signage and Public Navigation
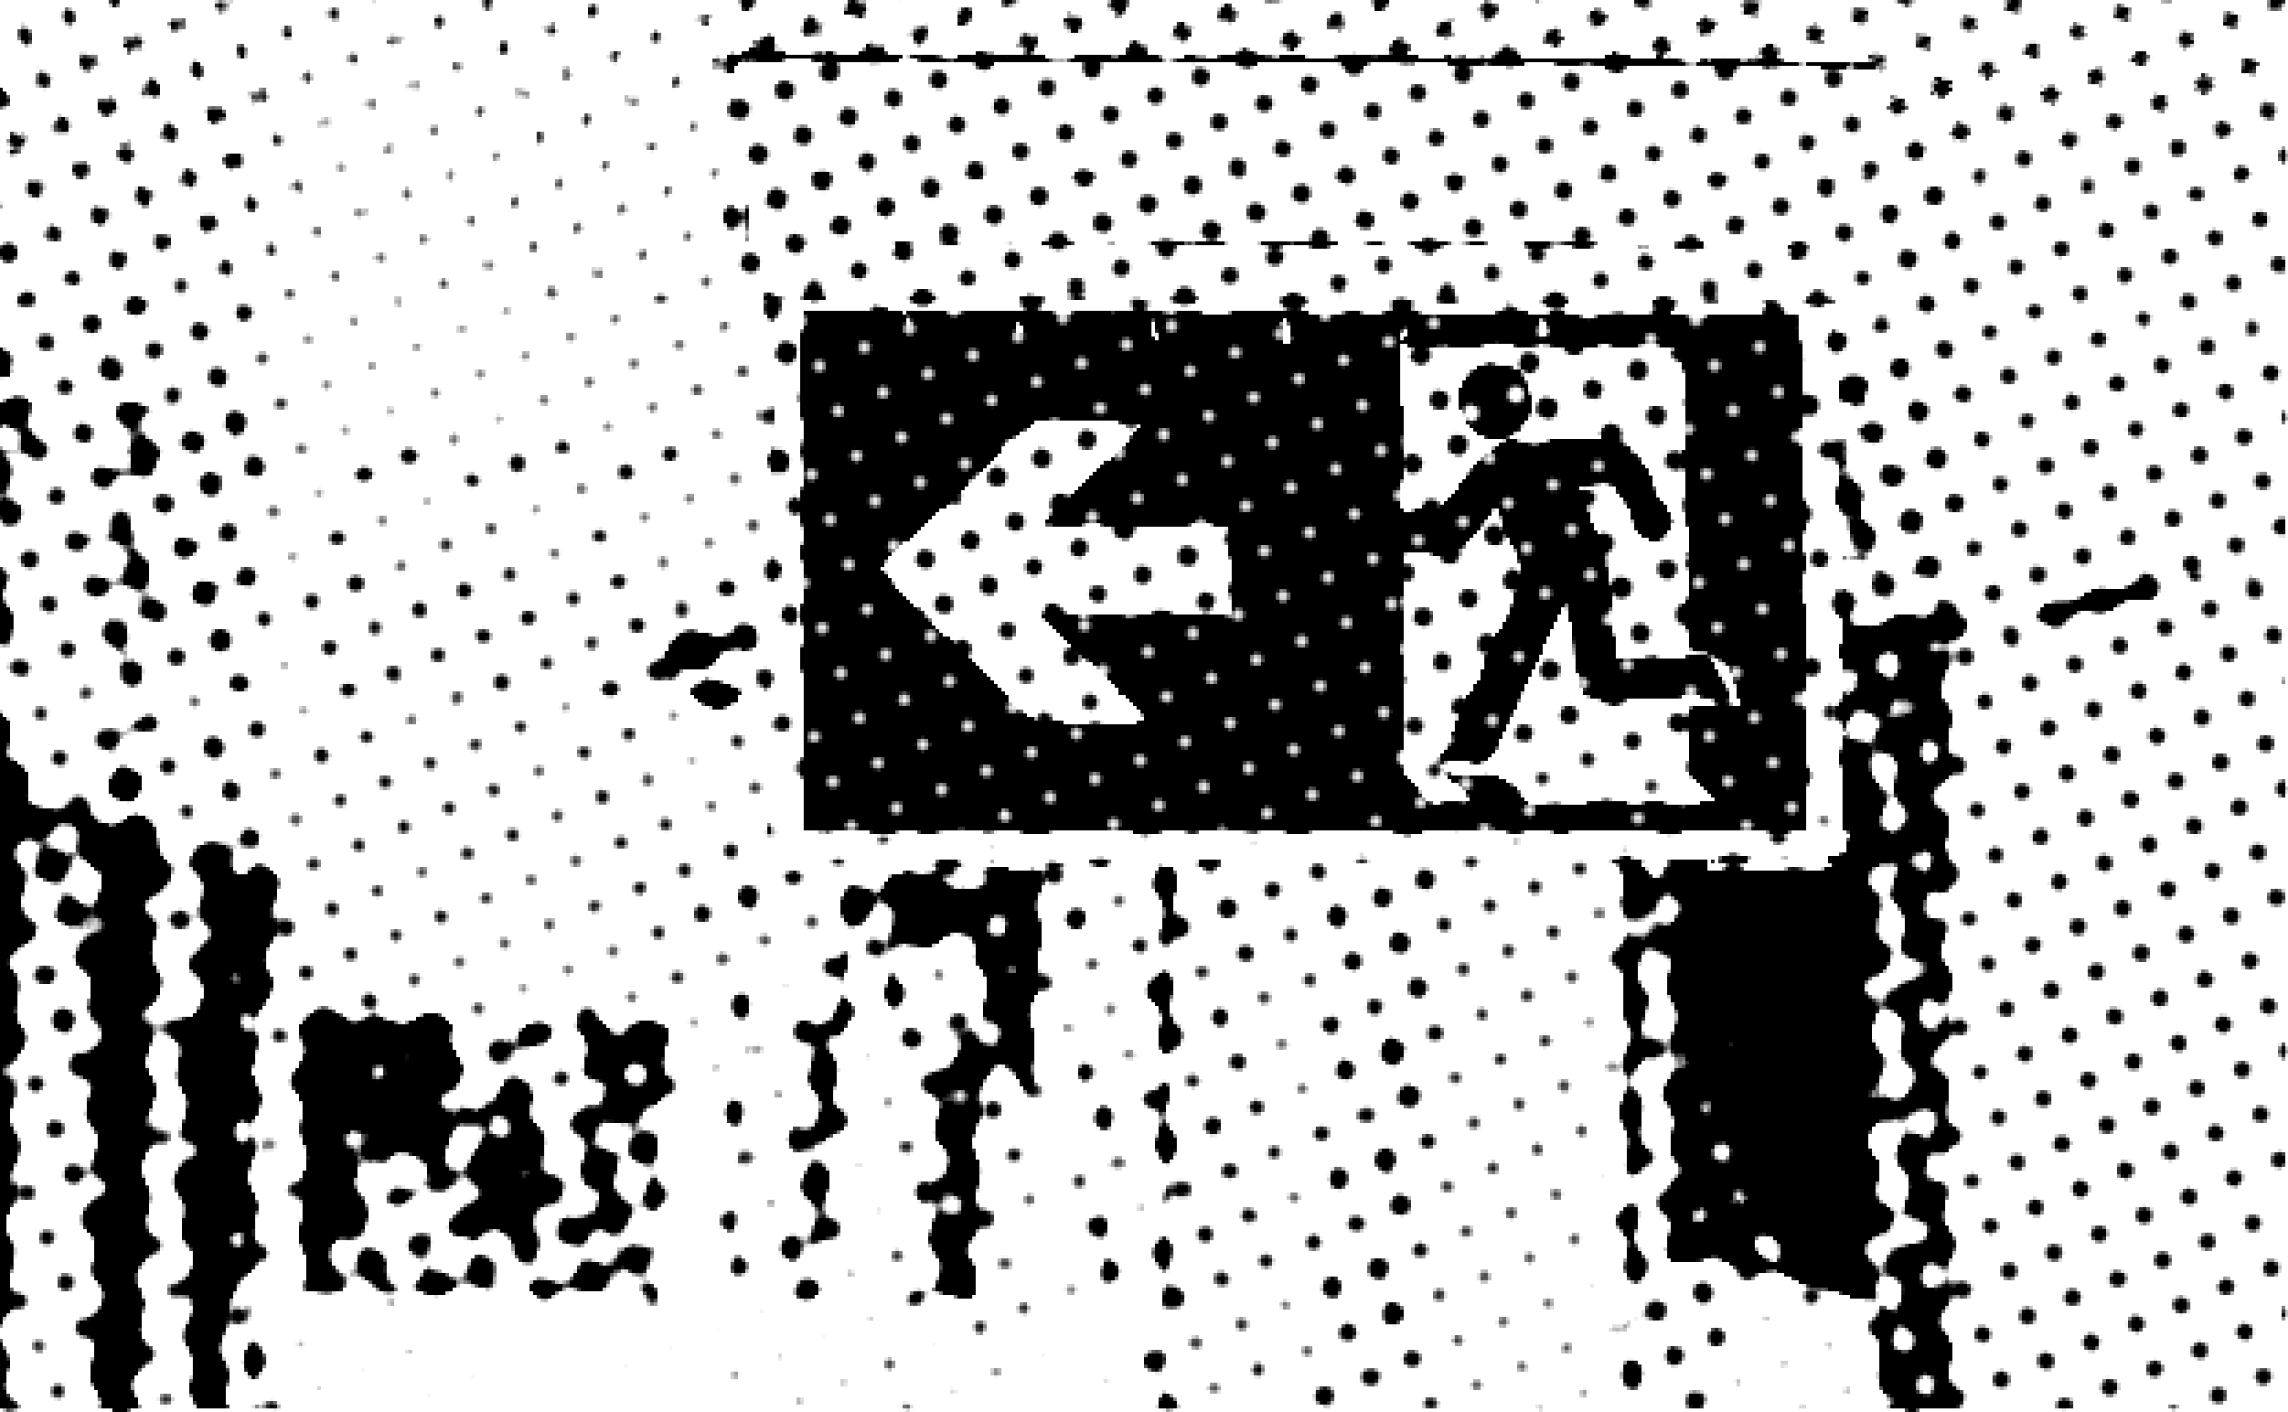
Emergency exit and fire safety signs use clear directional arrows and high-contrast colours to help individuals find safe routes during emergencies. In busy environments like airports and shopping centers, effective wayfinding design is crucial for guiding large crowds. The London Underground, for example, employs a well-structured system of colour-coded lines, arrows, and simple icons to efficiently direct passengers.
Research on Visual Cues and Crowd Steering
Corbetta et al. (2017) conducted an experiment at the Glow 2017 Light Festival in Eindhoven, Netherlands, demonstrating how visual cues can steer large groups of people. Their study showed that directional arrows increased foot traffic toward a particular route by 6%, proving that design elements can influence movement patterns and social behaviour.
Bibliography:
[1]
Traboco, L., Pandian, H., Nikiphorou, E., & Gupta, L. (2022). Designing Infographics: Visual Representations for Enhancing Education, Communication, and Scientific Research. Journal of Korean medical science, 37(27), e214. https://doi.org/10.3346/jkms.2022.37.e214
Lawson, A., & Vaganay-Miller, M. (2019). The Effectiveness of a Poster Intervention on Hand Hygiene Practice and Compliance When Using Public Restrooms in a University Setting. International journal of environmental research and public health, 16(24), 5036. https://doi.org/10.3390/ijerph16245036
[2]
[3]
Enhancing Compliance with Safety Measures
The use of universal symbols and visually compelling graphics not only promotes safer behaviours but also aids medical personnel in their communication efforts. Graphic design is most effective when tailored to the target audience, ensuring that information is presented in an engaging and accessible manner. By transforming complex health and safety data into clear, memorable visuals, designers can significantly influence behaviour, ensuring greater adherence to safety guidelines and improved public health outcomes.


[4]
[6]
[5]
Mansoor LE, Dowse R. Effect of pictograms on readability of patient
information materials. Ann Pharmacother .
Michielutte R, Bahnson J, Digman MB, Schroeder E. The use of illustrations and narrative text style to improve readability of a health education brochure. J Cancer Educ 1992;7:251–60.
Levie WH. Research on pictures: a guide to the literature. In: Willows
DM, editor. The psychology of illustration, vol. 1. New York: HA,
Houghton; 1987. p. 2–50 [10].
Li, N., & Molder, A. L. (2021). Can scientists use simple infographics to convince? Effects of the “flatten the curve” charts on perceptions of and behavioral intentions toward social distancing measures during the COVID-19 pandemic. Public Understanding of Science, 30(7), 898-912. https://doi.org/10.1177/09636625211038719
[7]
Delp, C. and Jones, J. (1996), Communicating Information to Patients: The Use of Cartoon Illustrations to Improve Comprehension of Instructions. Academic Emergency Medicine, 3: 264-270. https://doi.org/10.1111/j.1553-2712.1996.tb03431.x
Kearns C, Kearns N. The role of comics in public health communication during the COVID-19 pandemic. J Vis Commun Med. 2020 Jul;43(3):139-149. doi: 10.1080/17453054.2020.1761248. Epub 2020 Jul 9. PMID: 32643470.
[8]
[9]
[10]
[12]
[11]
Severtson, D. J., & Henriques, J. B. (2009). The effect of graphics on environmental health risk beliefs, emotions, behavioral intentions, and recall. Risk analysis : an official publication of the Society for Risk Analysis, 29(11), 1549–1565. https://doi.org/10.1111/j.1539-6924.2009.01299.x
Vertesi, J. (2008). Mind the Gap: The London Underground Map and Users’ Representations of Urban Space. Social Studies of Science, 38(1), 7-33. https://doi.org/10.1177/0306312707084153
Peter S. Houts, Cecilia C. Doak, Leonard G. Doak, Matthew J. Loscalzo,
The role of pictures in improving health communication: A review of research on attention, comprehension, recall, and adherence,
Patient Education and Counseling, Volume 61, Issue 2, 2006, Pages 173-190
Passini, R., Rainville, C., Marchand, N., & Joanette, Y. (1998). WAYFINDING AND DEMENTIA: SOME RESEARCH FINDINGS AND A NEW LOOK AT DESIGN. Journal of Architectural and Planning Research, 15(2), 133–151. http://www.jstor.org/stable/43030452
[13]
Bubric K, Harvey G, Pitamber T. A User-Centered Approach to Evaluating Wayfinding Systems in Healthcare. HERD: Health Environments Research & Design Journal. 2021;14(1):19-30. doi:10.1177/1937586720959074
Devlin A. S. (2014). Wayfinding in healthcare facilities: contributions from environmental psychology. Behavioral sciences (Basel, Switzerland), 4(4), 423–436. https://doi.org/10.3390/bs4040423
[14]
[15]
[16]
[18]
[17]
Thorpe S, Fize D, Marlot C. Speed of processing in the human visual system. Nature. 1996 Jun 6;381(6582):520-2. doi: 10.1038/381520a0. PMID: 8632824. https://pubmed.ncbi.nlm.nih.
Egan, M., Acharya, A., Sounderajah, V., Xu, Y., Mottershaw, A., Phillips, R., Ashrafian, H., & Darzi, A. (2021). Evaluating the effect of infographics on public recall, sentiment and willingness to use face masks during the COVID-19 pandemic: a randomised internet-based questionnaire study. BMC public health, 21(1), 367. https://doi.org/10.1186/s12889-021-10356-0
Houts, P. S., Doak, C. C., Doak, L. G., & Loscalzo, M. J. (2006). The role of pictures in improving health communication: A review of research on attention, comprehension, recall, and adherence. Patient Education and Counseling., 61(2), 173–190. https://doi.org/10.1016/j.pec.2005.05.004
Passini, R., Rainville, C., Marchand, N., & Joanette, Y. (1998). WAYFINDING AND DEMENTIA: SOME RESEARCH FINDINGS AND A NEW LOOK AT DESIGN. Journal of Architectural and Planning Research, 15(2), 133–151. http://www.jstor.org/stable/43030452